Identifying a possible non-linear rule for a given table of values
Identifying a possible non-linear rule for a given table of values
Question 1
The relationship between two variables, x and y, is shown in the table.
| x | 0 | −1 | −2 | −3 |
|---|---|---|---|---|
| y | 1 | 3 | 9 | 19 |
Which equation best describes the relationship between x and y ?
| y = 1− 2x² | y = 2x + 1 | y = 2x² + 1 | y = 1− 2x |
Solution
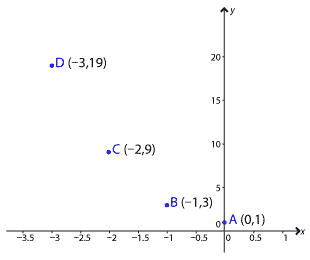
First note that when the points are plotted they do not lie on a straight line. We say the relationship is non-linear.
Example of a linear graph
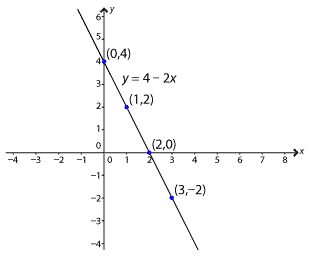
Note: For linear graphs the change in the y value as the x value increases by one is always the same. In the example to the right: as the x value increases by 1, the y value decreases by 2.
© Australian Mathematical Sciences Institute, except where indicated otherwise. This material is licensed under a Creative Commons Attribution-NonCommercial 3.0 Unported (CC BY-NC 3.0) licence http://creativecommons.org/licenses/by-nc/3.0/
![]()