History and applications
World population
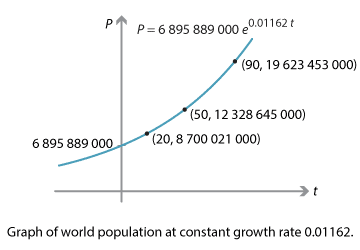
In 2010 the UN Department of Economic and Social Affairs released a series of reports on world population (see the References section). The UN estimated the continuous growth rate of world population then at \(1.162\%\), and the total population at approximately \(6\ 895\ 889\ 000\).
The UN projected that the population growth rate would change significantly over time; assuming a constant growth rate is unrealistic. But for present purposes, let us assume a constant growth rate and see what happens — and how the result compares with the UN's more accurate modelling.
Let \(P\) be the world population at time \(t\) years after 2010. With continuous growth rate \(1.162\%\), we have
\[ \dfrac{dP}{dt} = 0.01162 \, P, \]which has general solution \(P(t) = C e^{0.01162 \, t}\). Since \(P(0) = 6\,895\,889\,000\), we have
\[ P(t) = 6\,895\,889\,000 \, e^{0.01162 \, t}. \]We can now compute and graph world population.
| Year | \(t\) (years) | \(P\) (nearest thousand) |
|---|---|---|
| 2010 | 0 | \(6\ 895\ 889\ 000\) |
| 2020 | 10 | \(7\ 745\ 604\ 000\) |
| 2030 | 20 | \(8\ 700\ 021\ 000\) |
| 2060 | 50 | \(12\ 328\ 645\ 000\) |
| 2100 | 90 | \(19\ 623\ 453\ 000\) |
Assuming exponential growth, the world's population almost doubles in 50 years, and approaches 20 billion by 2100. However, all of the UN's projections were lower than this. For instance, the UN's 'medium fertility' projection gives a total world population of about half of our estimate, 10.9 billion, by 2100. A model of exponential growth is unrealistic.
Next page - History and applications - HIV virus population growth and decay

