![]()
Histograms
Numerical data can be displayed in a histogram. Data grouped into classes are often displayed this way. It is a graph in which the frequencies of the data are displayed by touching columns.
Example 4
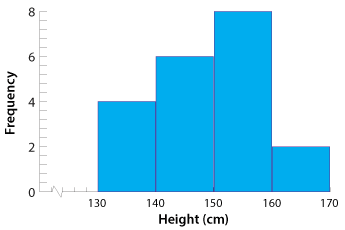
The heights of 20 year 9 students were measured and the results are shown in the frequency table below. Represent this information in a histogram. The heights were measured correct to the nearest centimetre.
| Height (in cm) | Frequency |
|---|---|
| 130–139 | 4 |
| 140–149 | 6 |
| 150–159 | 8 |
| 160–169 | 2 |
Solution
Here the class interval or bin width is 10 centimetres.
Varying the class interval or bin width on a histogram highlights different aspects of the data set.
Example 5
In a medical test, a group of students had the distance from hip to heel measured. The measurements were made correct to the nearest centimetre. The results were as follows:
| 85 | 86 | 91 | 87 | 77 | 88 | 83 | 86 | 74 | 89 | 85 | 85 | 80 |
| 94 | 82 | 84 | 89 | 84 | 94 | 84 | 76 | 93 | 86 | 84 | 94 | 84 |
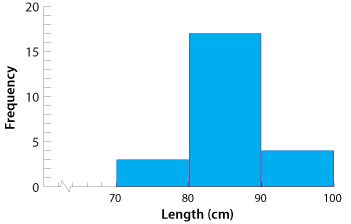
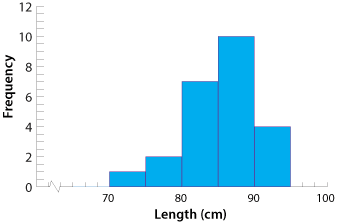
| CLASS INTERVAL 10 | CLASS INTERVAL 5 |
|---|---|
 Detailed description |
 Detailed description |
Notice that the histogram with the smaller class interval reveals more about the data than that with the larger class interval. We can see that the most common measurement was in the range 85–89 cm.
Example 6
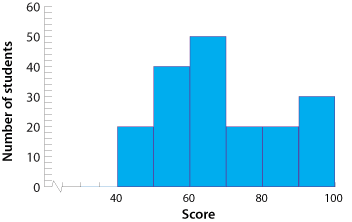
This histogram gives information about the results of year 9 students in a history examination.
- How many students sat for the examination?
- If the pass mark was 60, how many students would pass?
- What percentage of students obtained 90 or more?
- What percentage of students obtained less than 70?
Solution
\begin{align}\hspace{-5px}{\textbf{a}}\hspace{10px} \text{No. of students}\ &= \text{sum of the frequencies}\\\\ &= 20 + 40 + 50 + 20 + 20 + 30\\\\ &= 180\ \text{students}\end{align}\begin{align}\hspace{-5px}{\textbf{b}}\hspace{10px} \text{No. who passed}\ &= \text{no. with score} > 60\\\\ &= 50 + 20 + 20 + 30\\\\ &= 120\ \text{students}\end{align}
\begin{align}\hspace{-5px}{\textbf{c}}\hspace{10px} \text{No. with score}\ > 90 &= 30\\\\ \%\ \text{with score} > 90 &=\dfrac{30}{180}×\dfrac{100}{1}\\\\ &= 16\dfrac{2}{3}\%\end{align}
\begin{align}\hspace{-5px}{\textbf{d}}\hspace{10px} \text{No. with score}\ < 70 &= 130\\\\ \%\ \text{with score}\ < 70 &=\ \dfrac{110}{180} × \dfrac{100}{1}\\\\ &= 61\dfrac{1}{9}\%\ \end{align}


