![]()
Comparing data displays
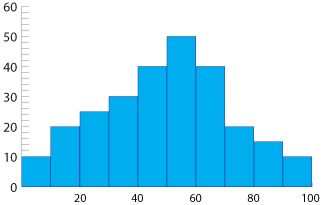
The data displayed in the histogram above is said to be symmetrical.
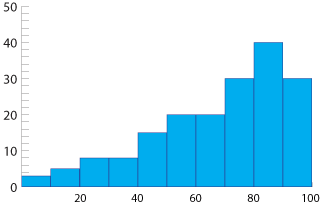
The data displayed in the histogram above is said to be negatively skewed. It has a long tail to the left and a very short tail to the right.
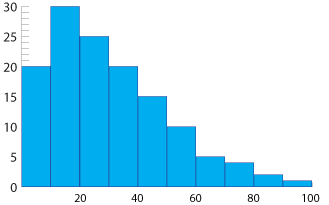
The data displayed in the histogram above is said to be positively skewed. It has a long tail to the right and a very short tail to the left.
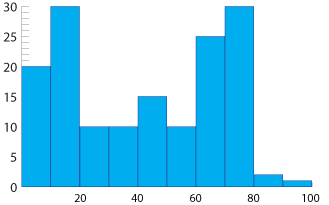
The data displayed in the histogram above is bimodal. There are two modes.


