![]()
Tables of values
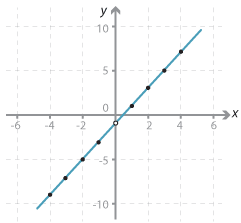
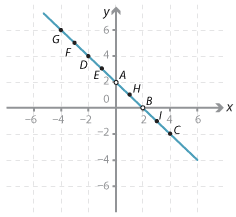
Given the rule for a relationship, we can complete a table of values and plot the points on the Cartesian plane.
Example 2
 y = 2x − 1
x –4 –3 –2 –1 0 1 2 3 4 y –9 –7 –5 –3 –1 1 3 5 7  y = –x + 2
x –4 –3 –2 –1 0 1 2 3 4 y 6 5 4 3 2 1 0 –1 –2


